[nutanix@harbor nkp]$ docker login 10.38.252.79
Username: admin
Password:

WARNING! Your credentials are stored unencrypted in '/home/nutanix/.docker/config.json'.
Configure a credential helper to remove this warning. See
https://docs.docker.com/go/credential-store/

Login Succeeded
ติดตั้ง kubectl สำหรับเข้าถึง kubernetes
[nutanix@harbor nkp-v2.17.0]$ sudo curl -Lo /usr/local/bin/kubectl https://storage.googleapis.com/kubernetes-release/release/$(curl -s https://storage.googleapis.com/kubernetes-release/release/stable.txt)/bin/linux/amd64/kubectl
  % Total    % Received % Xferd  Average Speed   Time    Time     Time  Current
                                 Dload  Upload   Total   Spent    Left  Speed
100 53.7M  100 53.7M    0     0  74.2M      0 --:--:-- --:--:-- --:--:-- 74.3M
[nutanix@harbor nkp-v2.17.0]$ sudo chmod +x /usr/local/bin/kubectl
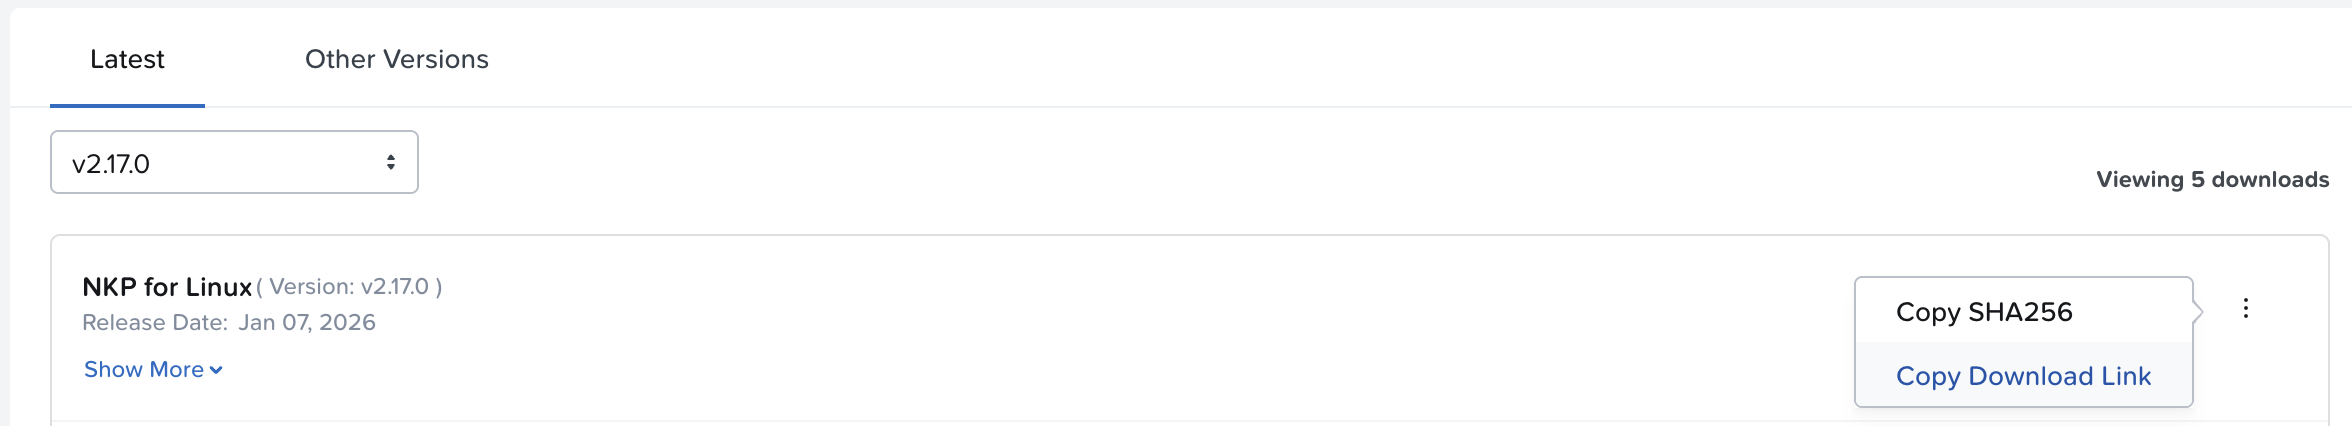
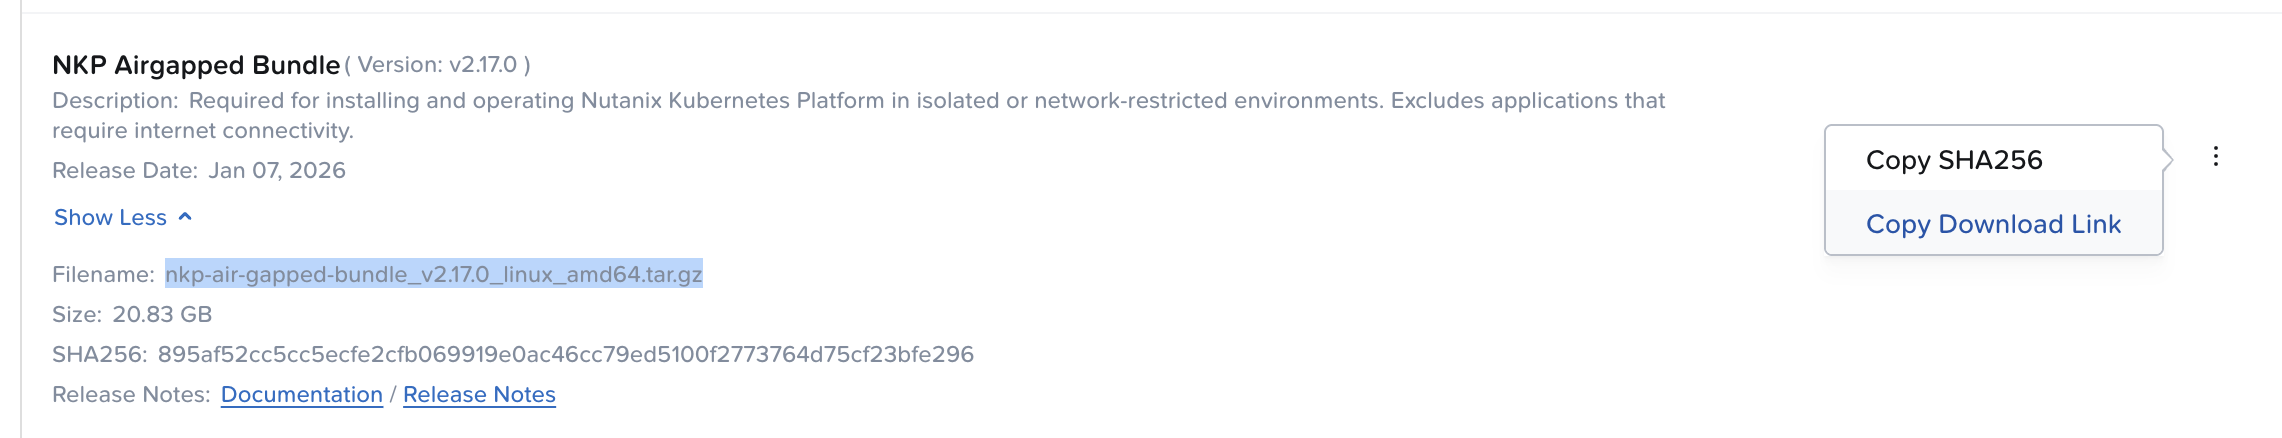
[nutanix@harbor ~]$ curl -o nkp-air-gapped-bundle_v2.17.0_linux_amd64.tar.gz "https://download.nutanix.com/downloads/nkp/v2.17.0/nkp-air-gapped-bundle_v2.17.0_linux_amd64.tar.gz?Expires=1768402002&Key-Pair-Id=APKAJTTNCWPEI42QKMSA&Signature=DINg8wm1mGZR8fgXilavLmDe81UR126bHPdhLddcLuz8BQrXOPWSzHW29kVrNNUXP~CMS-cLArguoPGDwljnmBDaFACTsA9n~ooyA~Ff~9TEyjHiaWaNjez9gVawoyvHszti7Mfad7Bj4btFIsK9xGVYhJSuWAOryx2ieltb3GOEKrjjgZY4ykw7i3EzZrd9hXRga0DjbE3Lfy-YX~2h0~uhH~XiF08tvOI~LfTMi7AZDt2hJyZYgcXPqeVDJuFjureFdb4J4NNRu-lwbbrqipAQoMIYIOwUPLdV0oRFad4MAOUqqMhZIikSQSoYznkLb5WiFeVGxaagjcPFjflS1w__"
  % Total    % Received % Xferd  Average Speed   Time    Time     Time  Current
                                 Dload  Upload   Total   Spent    Left  Speed
100 20.8G  100 20.8G    0     0   135M      0  0:02:37  0:02:37 --:--:--  139M
[nutanix@harbor ~]$ tar -xvf nkp-air-gapped-bundle_v2.17.0_linux_amd64.tar.gz

[nutanix@harbor nkp]$ cd nkp-v2.17.0/
[nutanix@harbor nkp-v2.17.0]$ docker load -i konvoy-bootstrap-image-v2.17.0.tar

[nutanix@harbor nkp-v2.17.0]$ docker image ls | grep konvoy-bootstrap
WARNING: This output is designed for human readability. For machine-readable output, please use --format.
mesosphere/konvoy-bootstrap:v2.17.0     9f13ef224cd1       5.86GB         2.92GB

[nutanix@harbor nkp-v2.17.0]$ nkp push bundle --bundle ./container-images/konvoy-image-bundle-v2.17.0.tar --to-registry=10.38.252.79/nkp --to-registry-username=admin --to-registry-password=Harbor12345 --to-registry-insecure-skip-tls-verify

[nutanix@harbor nkp-v2.17.0]$ nkp push bundle --bundle ./container-images/kommander-image-bundle-v2.17.0.tar --to-registry=10.38.252.79/nkp --to-registry-username=admin --to-registry-password=Harbor12345 --to-registry-insecure-skip-tls-verify
สร้าง ssh key สำหรับ access VM ที่สร้างขึ้นโดยระบบ
[nutanix@harbor ~]$ ssh-keygen -t ed25519
Generating public/private ed25519 key pair.
Enter file in which to save the key (/home/nutanix/.ssh/id_ed25519):
Enter passphrase (empty for no passphrase):
Enter same passphrase again:
Your identification has been saved in /home/nutanix/.ssh/id_ed25519
Your public key has been saved in /home/nutanix/.ssh/id_ed25519.pub
The key fingerprint is:
SHA256://XGZ4k3rrFq2BC+QWmPk3NJNt972vQ5vHrnSuOyTm0 nutanix@harbor.local
The key's randomart image is:
+--[ED25519 256]--+
|                 |
|                 |
|          .      |
|         = +     |
|        S B + .  |
|         X + o . |
|          @ ..E.+|
|         o =.*o&X|
|          .o=*XX%|
+----[SHA256]-----+
Performance: Ed25519 is significantly faster for both signing and verification operations. It uses elliptic curve cryptography which requires less computational overhead than RSA’s integer factorization approach.
Key size: Ed25519 uses 256-bit keys that provide security equivalent to 3072-bit RSA keys. This means much smaller key sizes for the same security level, reducing storage and transmission overhead.
Security design: Ed25519 was designed from the ground up to avoid many implementation pitfalls that have plagued RSA. It’s resistant to timing attacks, doesn’t require careful random number generation during signing (unlike RSA), and uses deterministic signatures.
Simplicity: The algorithm has fewer parameters and configuration options, reducing the chance of implementation errors. RSA requires choosing padding schemes, key sizes, and other parameters that can introduce vulnerabilities if done incorrectly.
Side-channel resistance: Ed25519 is designed to be resistant to side-channel attacks like timing and power analysis attacks, whereas RSA implementations often leak information through timing variations.
Future-proofing: While both are considered secure today, Ed25519’s elliptic curve foundation generally scales better as security requirements increase over time.
The main trade-off is that RSA is more widely supported in legacy systems, but for new applications, Ed25519 is generally the better choice due to its superior performance and security characteristics.
ติดตั้ง NKP ด้วย cli โดยจะต้อง export user และ password variable ก่อนจะ run nkp command
กรณีที่การติดตั้งสามารถ access internet ได้ไม่จำเป็นต้องใช้ option –airgapped และระบบจะทำการติดตั้งโดยใช้ค่า default ถ้าไม่ระบุใน cli เช่น ขนาดของ VM และจำนวน VM เช่น Control plane จำนวน 3 VMs และ Worker จำนวน 4 VMs ดังตัวอย่าง options อื่นๆ ดังนี้
𝗘𝗡𝗩𝗜𝗥𝗢𝗡𝗠𝗘𝗡𝗧 𝗩𝗔𝗥𝗜𝗔𝗕𝗟𝗘𝗦
export CLUSTER_NAME="wskn-mgmt-ag" # Name of the Kubernetes cluster
export NUTANIX_PC_FQDN_ENDPOINT_WITH_PORT="https://10.168.100.4:9440" # Nutanix Prism Central endpoint URL with port
export CONTROL_PLANE_IP="10.168.102.30" # IP address for the Kubernetes control plane
export IMAGE_NAME="nkp-rocky-9.4-release-1.29.6-20240816215147" # Name of the VM image to use for cluster nodes
export PRISM_ELEMENT_CLUSTER_NAME="wskn-nongpu" # Name of the Nutanix Prism Element cluster
export SUBNET_NAME="non-gpu-airgap" # Name of the subnet to use for cluster nodes
export PROJECT_NAME="default" # Name of the Nutanix project
export CONTROL_PLANE_REPLICAS="3" # Number of control plane replicas
export CONTROL_PLANE_VCPUS="4" # Number of vCPUs for control plane nodes
export CONTROL_PLANE_CORES_PER_VCPU="1" # Number of cores per vCPU for control plane nodes
export CONTROL_PLANE_MEMORY_GIB="16" # Memory in GiB for control plane nodes
export WORKER_REPLICAS="3" # Number of worker node replicas
export WORKER_VCPUS="8" # Number of vCPUs for worker nodes
export WORKER_CORES_PER_VCPU="1" # Number of cores per vCPU for worker nodes
export WORKER_MEMORY_GIB="32" # Memory in GiB for worker nodes
export NUTANIX_STORAGE_CONTAINER_NAME="default-container-xxx" # Name of the Nutanix storage container
export CSI_FILESYSTEM="ext4" # Filesystem type for CSI volumes
export CSI_HYPERVISOR_ATTACHED="true" # Whether to use hypervisor-attached volumes for CSI
export LB_IP_RANGE="10.168.102.31-10.168.102.31" # IP range for load balancer services
export SSH_KEY_FILE="/root/.ssh/id_rsa.pub" # Path to the SSH public key file
export NUTANIX_USER="admin" # Nutanix PrismCentral username (left blank for security)
export NUTANIX_PASSWORD="" # Nutanix PrismCentral password (left blank for security)
export REGISTRY_URL="https://registry.wskn-ag.local/library" # URL for the private container registry
export REGISTRY_USERNAME="admin" # Username for authenticating with the private registry (left blank for security)
export REGISTRY_PASSWORD="" # Password for authenticating with the private registry (left blank for security)
export REGISTRY_CA="/root/wskn-ag-certs/server.crt" # Path to the CA certificate for the private registry

𝗜𝗡𝗦𝗧𝗔𝗟𝗟𝗔𝗧𝗜𝗢𝗡 𝗖𝗢𝗠𝗠𝗔𝗡𝗗
nkp create cluster nutanix --cluster-name $CLUSTER_NAME \
    --endpoint $NUTANIX_PC_FQDN_ENDPOINT_WITH_PORT\
    --control-plane-endpoint-ip $CONTROL_PLANE_IP \
    --control-plane-vm-image $IMAGE_NAME \
    --control-plane-prism-element-cluster $PRISM_ELEMENT_CLUSTER_NAME \
    --control-plane-subnets $SUBNET_NAME \
    --control-plane-pc-project $PROJECT_NAME \
    --control-plane-replicas $CONTROL_PLANE_REPLICAS \
    --control-plane-vcpus $CONTROL_PLANE_VCPUS \
    --control-plane-cores-per-vcpu $CONTROL_PLANE_CORES_PER_VCPU \
    --control-plane-memory $CONTROL_PLANE_MEMORY_GIB \
    --worker-vm-image $IMAGE_NAME \
    --worker-prism-element-cluster $PRISM_ELEMENT_CLUSTER_NAME \
    --worker-subnets $SUBNET_NAME \
    --worker-pc-project $PROJECT_NAME \
    --worker-replicas $WORKER_REPLICAS \
    --worker-vcpus $WORKER_VCPUS \
    --worker-cores-per-vcpu $WORKER_CORES_PER_VCPU \
    --worker-memory $WORKER_MEMORY_GIB \
    --ssh-public-key-file $SSH_KEY_FILE \
    --csi-storage-container $NUTANIX_STORAGE_CONTAINER_NAME \
    --csi-file-system $CSI_FILESYSTEM \
    --csi-hypervisor-attached-volumes=$CSI_HYPERVISOR_ATTACHED \
    --kubernetes-service-load-balancer-ip-range $LB_IP_RANGE \
    --insecure \
    --self-managed \
    --airgapped \
    --registry-mirror-url $REGISTRY_URL \
    --registry-mirror-cacert $REGISTRY_CA \
    --registry-mirror-username=$REGISTRY_USERNAME \
    --registry-mirror-password=$REGISTRY_PASSWORD
Cluster default/nkp-mgmt kubeconfig was written to to the filesystem.
You can now view resources in the new cluster by using the --kubeconfig flag with kubectl.
For example: kubectl --kubeconfig="/home/nutanix/nkp-mgmt.conf" get nodes
Starting Kommander installation
✓ Deploying Flux
✓ Deploying Ingress certificate
✓ Creating kommander-overrides ConfigMap
✓ Deploying Git Operator
✓ Creating GitClaim for management GitRepository
✓ Creating GitClaimUser for accessing management GitRepository
✓ Deploying Flux configuration
✓ Deploying Kommander Operator
✓ Creating KommanderCore resource
✓ Cleaning up Kommander bootstrap resources
✓ Deploying Gatekeeper
✓ Creating PlatformVersionArtifact
✓ Deploying Kommander AppManagement
✓ 4 out of 14 core applications have been installed (waiting for dex, dex-k8s-authenticator and 8 more)
✓ 5 out of 14 core applications have been installed (waiting for dex, dex-k8s-authenticator and 7 more)
✓ 10 out of 14 core applications have been installed (waiting for dex-k8s-authenticator, kommander and 2 more)
✓ 11 out of 14 core applications have been installed (waiting for dex-k8s-authenticator, kommander-ui and 1 more)
✓ 13 out of 14 core applications have been installed (waiting for traefik-forward-auth-mgmt)
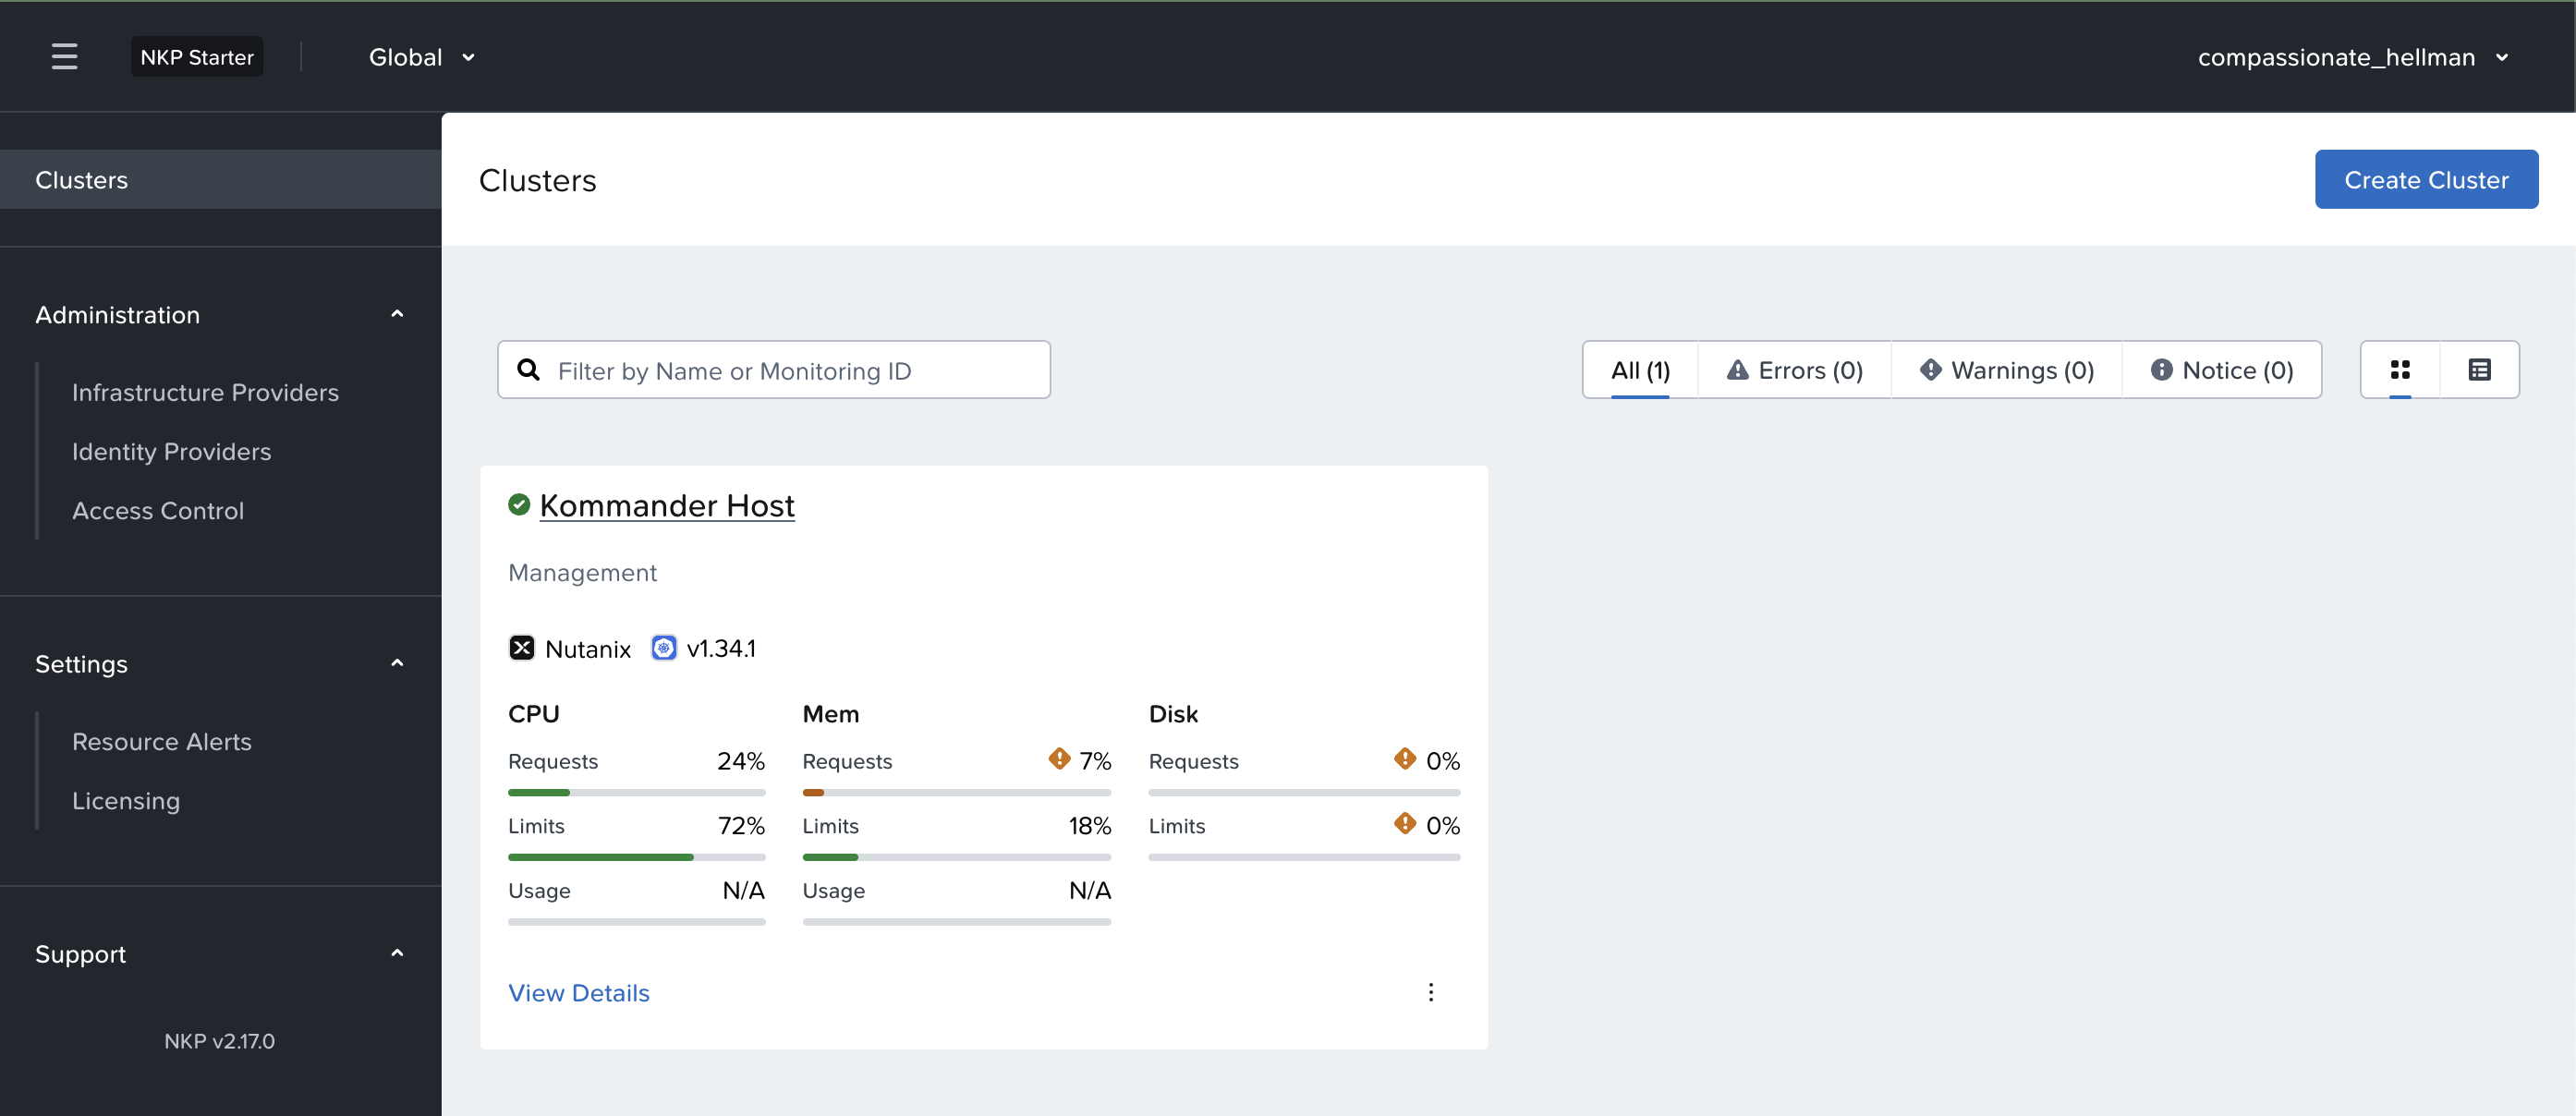
Cluster was created successfully! Get the dashboard details with:
nkp get dashboard --kubeconfig="/home/nutanix/nkp-mgmt.conf"
# Generate CA Key
[nutanix@harbor harbor]$ cd generate-cert
# 1. Generate CA (Root Authority)
[nutanix@harbor generate-cert]$ openssl genrsa -out ca.key 4096
[nutanix@harbor generate-cert]$ openssl req -x509 -new -nodes -sha512 -days 3650 \
-subj "/C=TH/ST=BKK/L=BKK/O=ntnxlab/OU=demo/CN=ntnxlab-Internal-CA Root CA" \
-key ca.key -out ca.crt
# 2. Generate Server Key
[nutanix@harbor generate-cert]$ openssl genrsa -out harbor.local.key 2048
# 3. Generate CSR (Certificate Signing Request)
# Use the actual address you will type into your browser/CLI as the CN
[nutanix@harbor generate-cert]$ openssl req -sha512 -new \
-subj "/C=TH/ST=BKK/L=BKK/O=ntnxlab/OU=demo/CN=ntnxlab.local" \
-key harbor.local.key -out harbor.local.csr
# 4. Create v3.ext (Crucial fix: CA:FALSE and proper SAN)
[nutanix@harbor generate-cert]$ cat > v3.ext <<-EOF
authorityKeyIdentifier=keyid,issuer
basicConstraints=CA:FALSE
keyUsage = digitalSignature, nonRepudiation, keyEncipherment, dataEncipherment
extendedKeyUsage = serverAuth
subjectAltName = @alt_names
[alt_names]
DNS.1=ntnxlab.local
DNS.2=*.ntnxlab.local
DNS.3=harbor.ntnxlab.local
IP.1=10.38.252.79 # REPLACE with your actual Harbor VM IP
EOF
# 5. Generate Server Certificate (Signed by the CA)
[nutanix@harbor generate-cert]$ openssl x509 -req -sha512 -days 3650 \
-extfile v3.ext \
-CA ca.crt -CAkey ca.key -CAcreateserial \
-in harbor.local.csr \
-out harbor.local.crt
# verify new CA, expect correct subject output
[nutanix@harbor generate-cert]$ openssl x509 -in ca.crt -nameopt sep_multiline -subject -noout
# verify new CA, Should return OK
[nutanix@harbor generate-cert]$ openssl verify -CAfile ca.crt harbor.local.crt
# verify new CA, Should show your DNS and IP
[nutanix@harbor generate-cert]$ openssl x509 -in harbor.local.crt -text -noout | grep -A 1 "Subject Alternative Name"
To make your Kubernetes nodes or Docker clients trust this certificate,
you must copy the ca.crt (not the harbor.local.crt) to the OS trust store:
RHEL/CentOS: Copy to /etc/pki/ca-trust/source/anchors/ and run update-ca-trust.
Ubuntu/Debian: Copy to /usr/local/share/ca-certificates/ and run update-ca-certificates.
Docker specific: Docker also requires the certs in
/etc/docker/certs.d/harbor.ntnxlab.local/ca.crt
# Optional - Convert the certificate to PEM format for docker
[nutanix@harbor generate-cert]$ openssl x509 -inform PEM -in harbor.local.crt -out harbor.local.cert
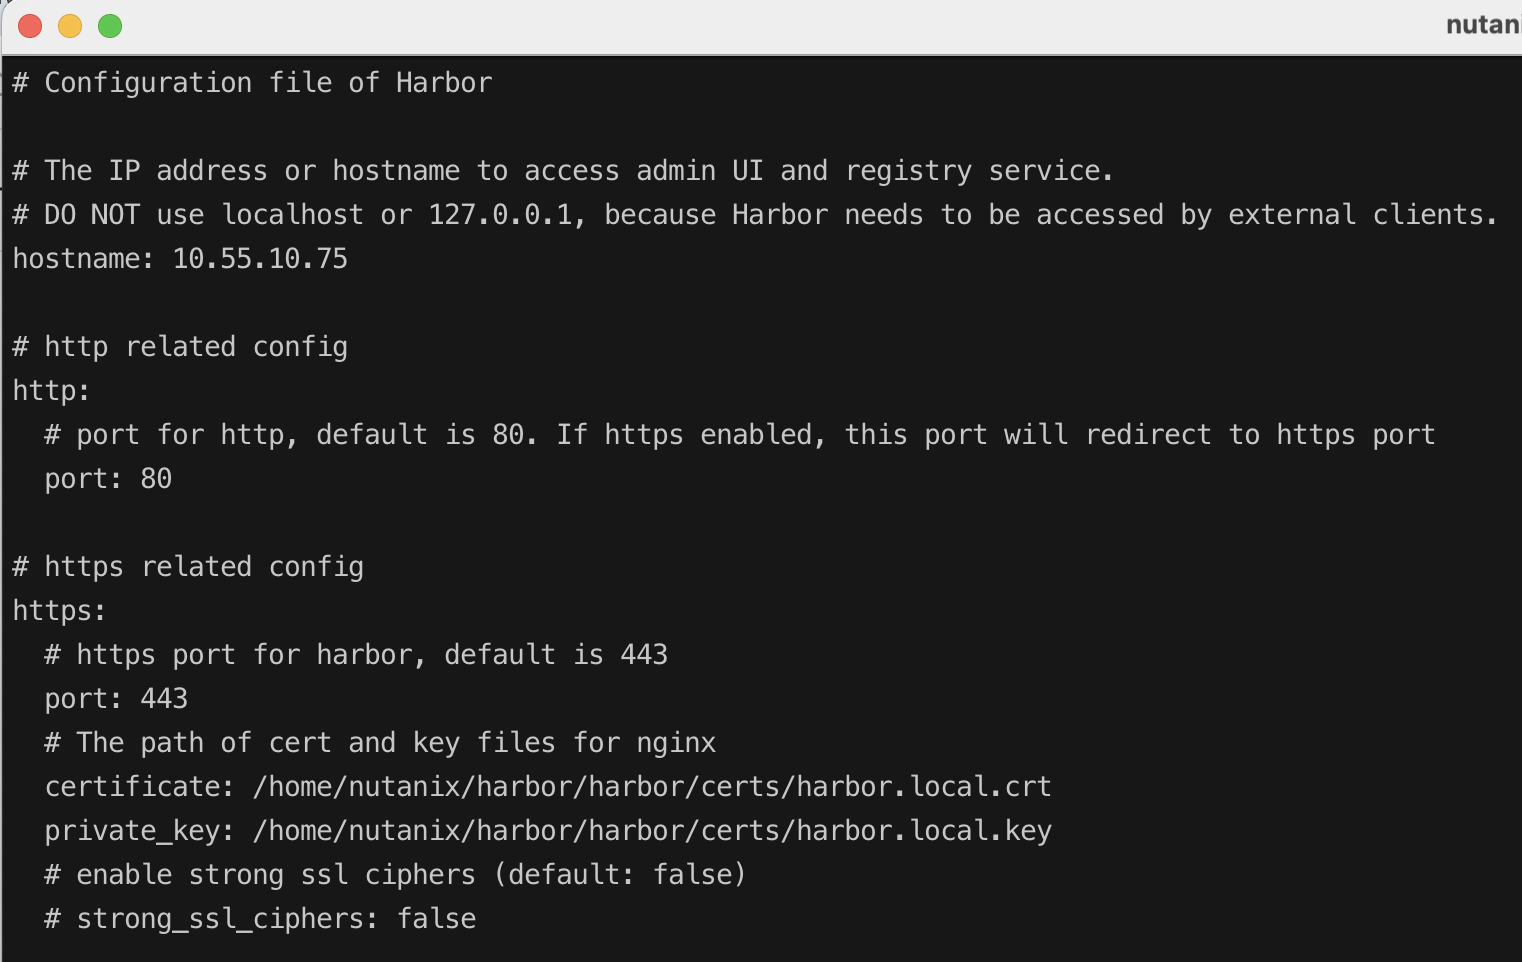
#copy harbor.local.crt and harbor.local.key for harbor server
[nutanix@harbor generate-cert]$ cp harbor.local.crt ../certs
[nutanix@harbor generate-cert]$ cp harbor.local.key ../certs
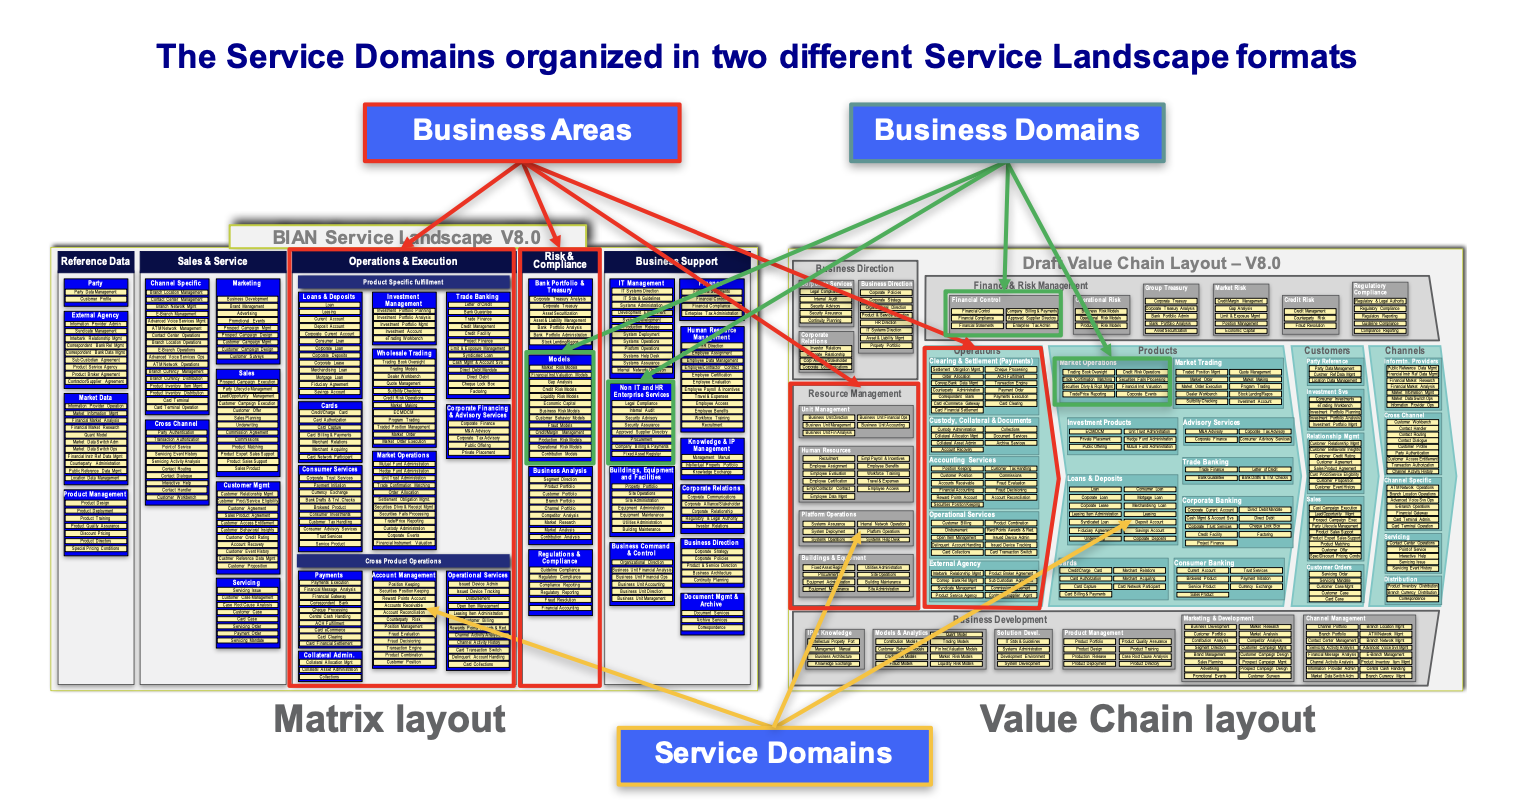
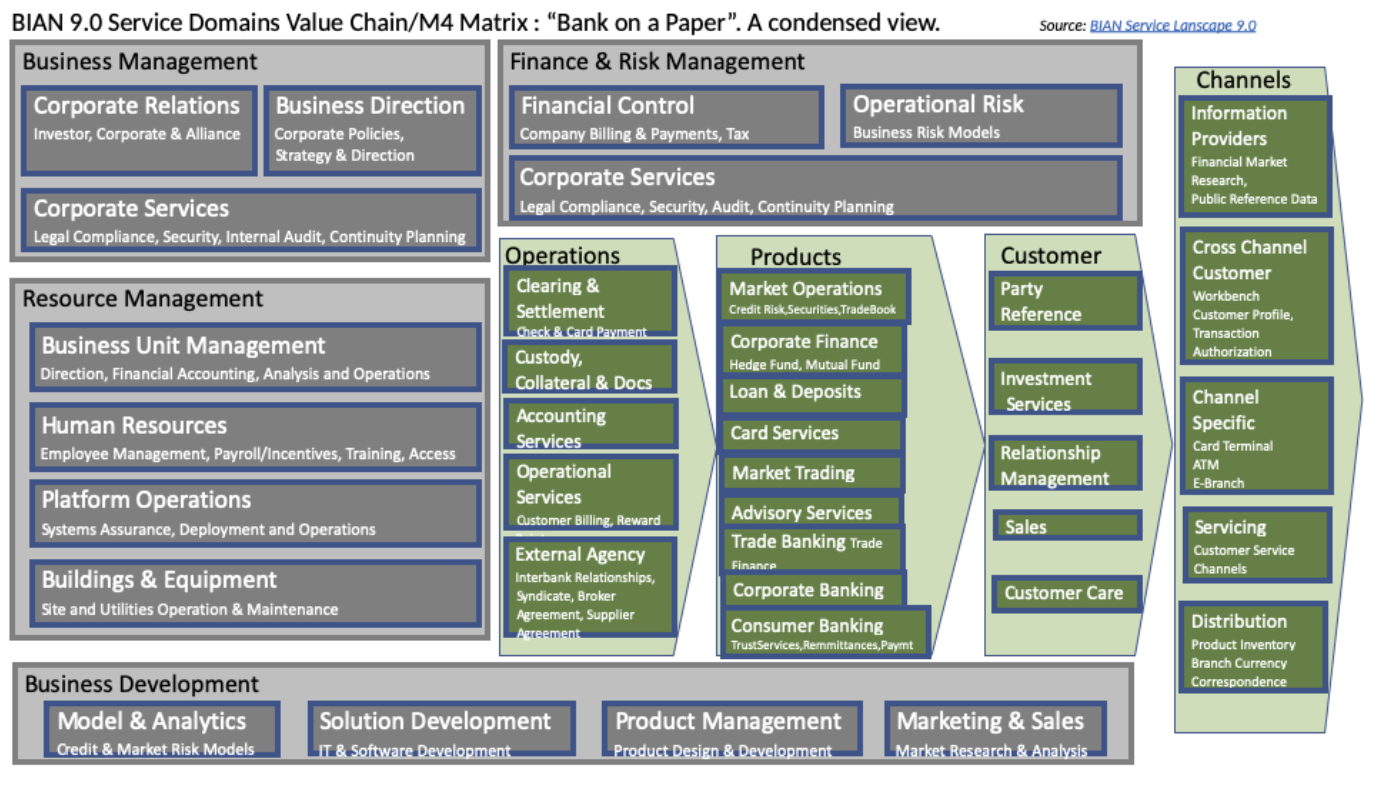
Business Area กลุ่มของ Function งานต่างๆ ในระบบธนาคาร
Business Domain เป็นกลุ่มของส่วนงานภายใน Business Area
Service Domain เป็นส่วนของงานภายใน Business Domain เพื่อทำงานอย่างใดอย่างหนึ่งเช่น Service Domain ชื่อ SavingAccount ก็จะสื่อถืองานเกี่ยวกับ Service Account ที่ provide API เพื่อทำงานเกี่ยวกับ Saving Account
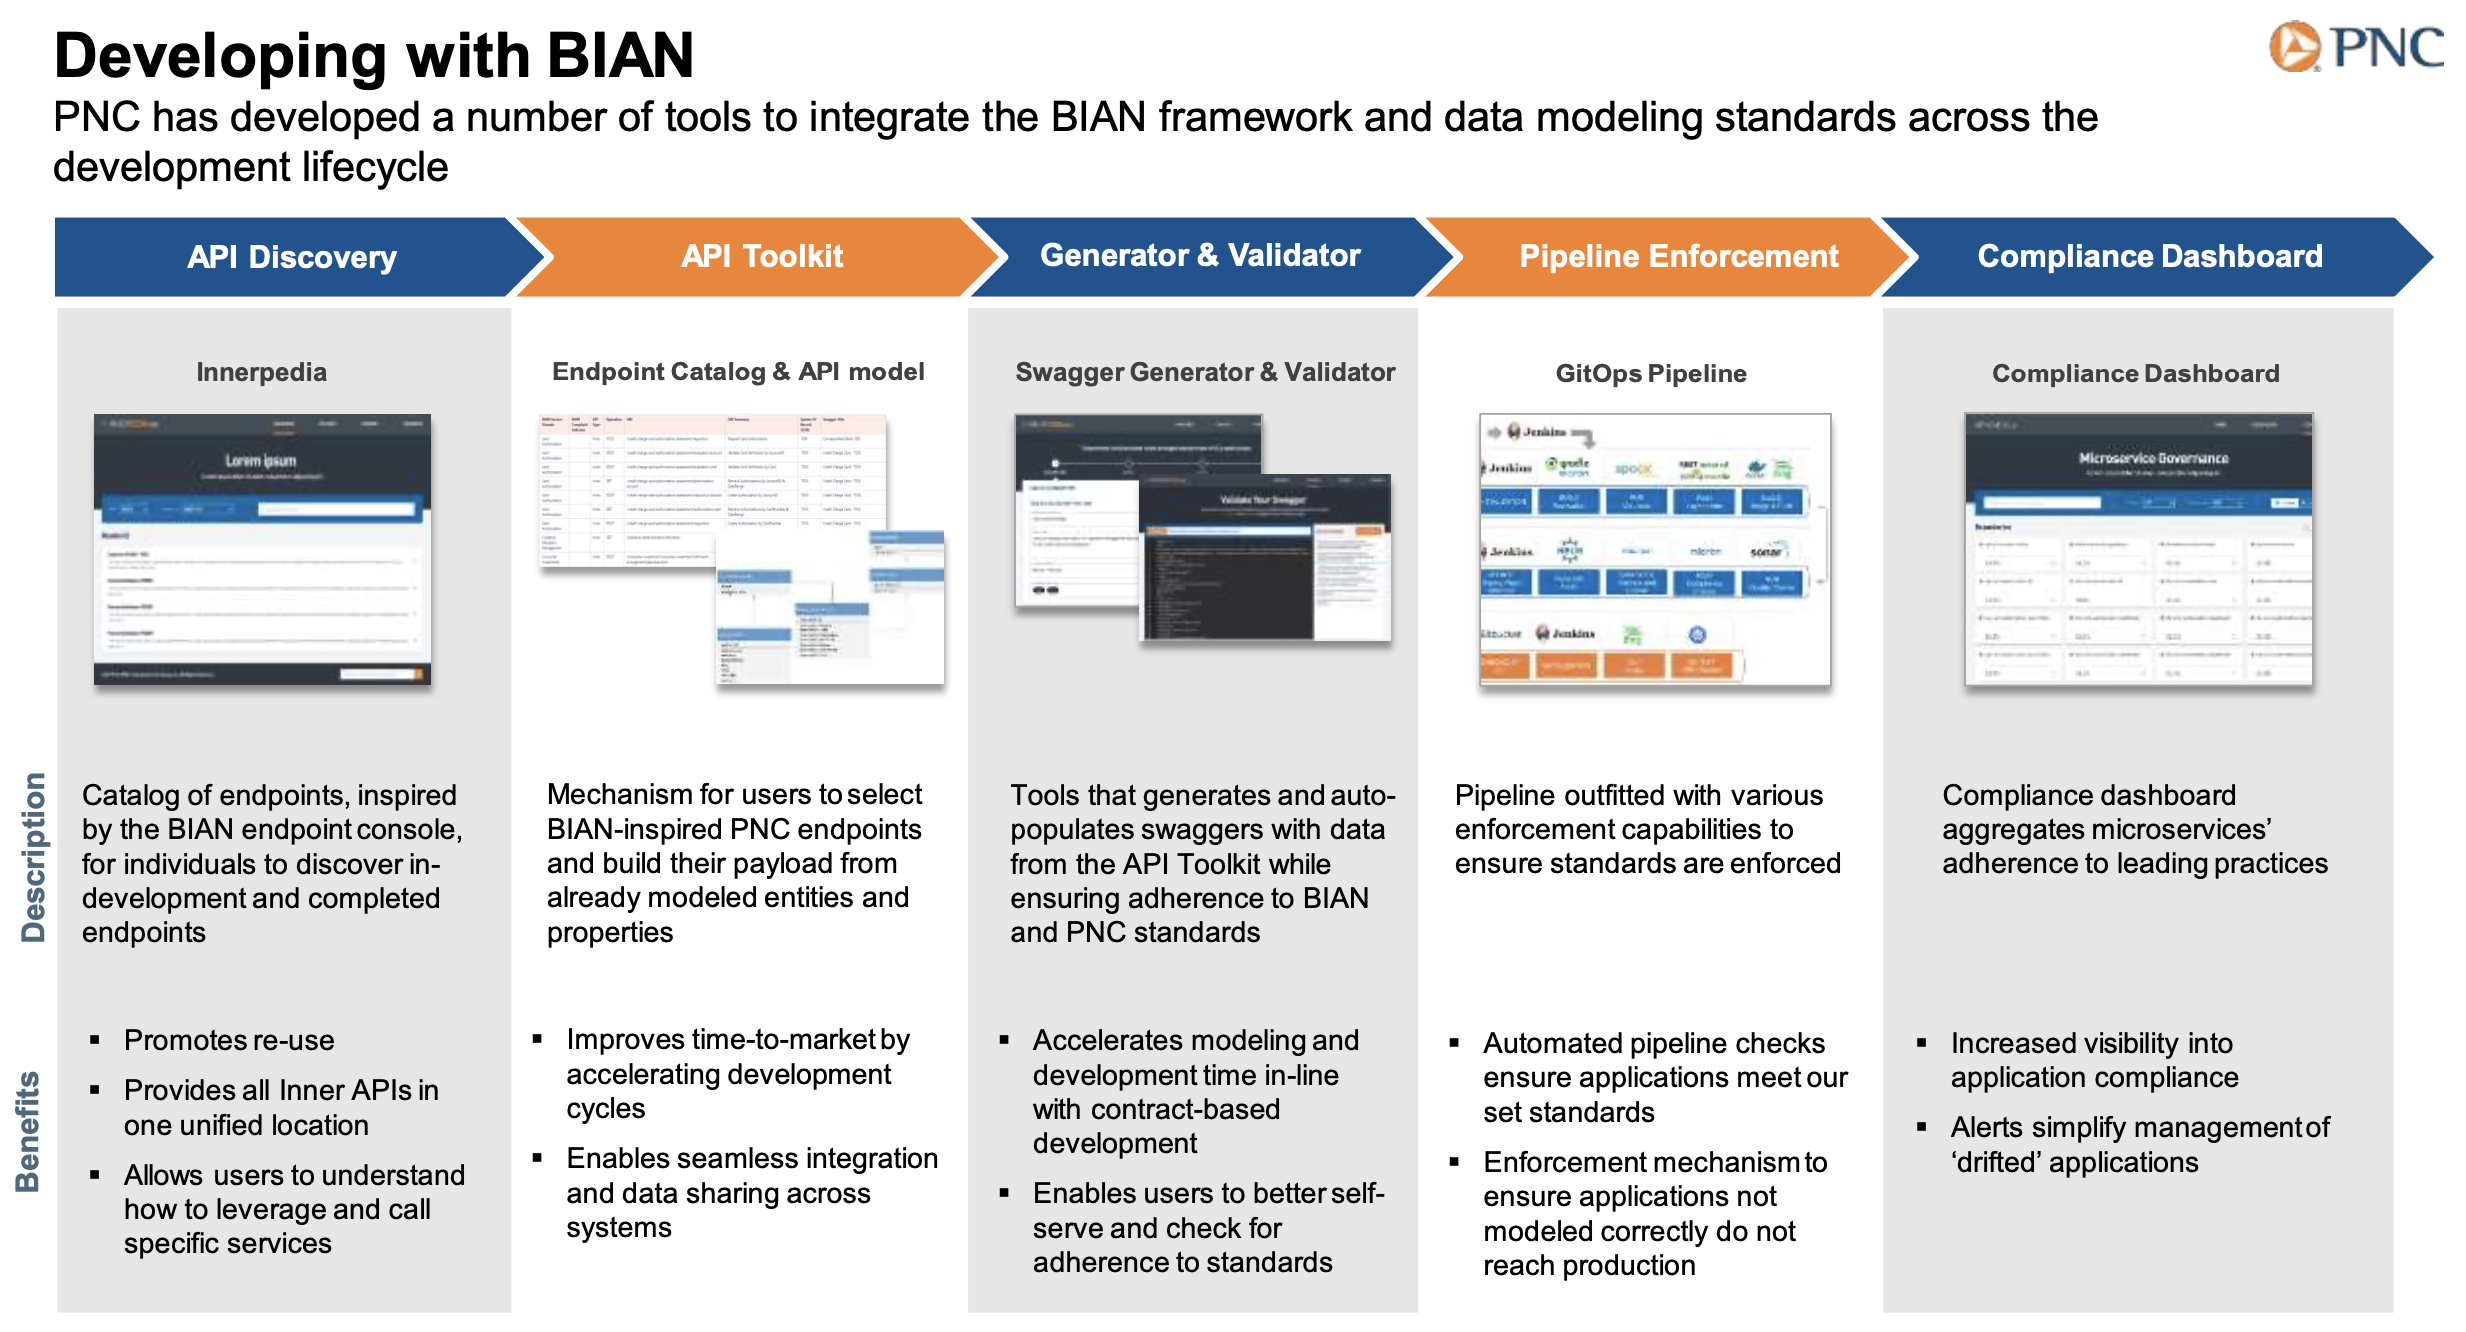
BIAN APIs ได้กำหนดข้อกำหนดมาตรฐานของ API โดยให้แบ่งเป็นแต่ละ Layer
Experience APIs เป็น APIs สำหรับ user interact ซึ่งจะ specific สำหรับกลุ่มของการใช้งาน
Process APIs เป็น process ของแต่ละ APIs ที่อาจจะมีการเรียกใช้หลาย APIs เพื่อประมวลผลและแสดงผลลัพธ์ที่ต้องการ (Orchestrator)
System APIs เป็น APIs ตามข้อกำหนดของ BIAN และ BIAN Object Model ในการเข้าถึง System of Record (SOR) อื่นๆ เพื่อไม่ให้มีการเรียกใช้ Resource ได้โดยตรง ป้องกันไม่ให้เกิด dependency กับระบบรอบข้าง
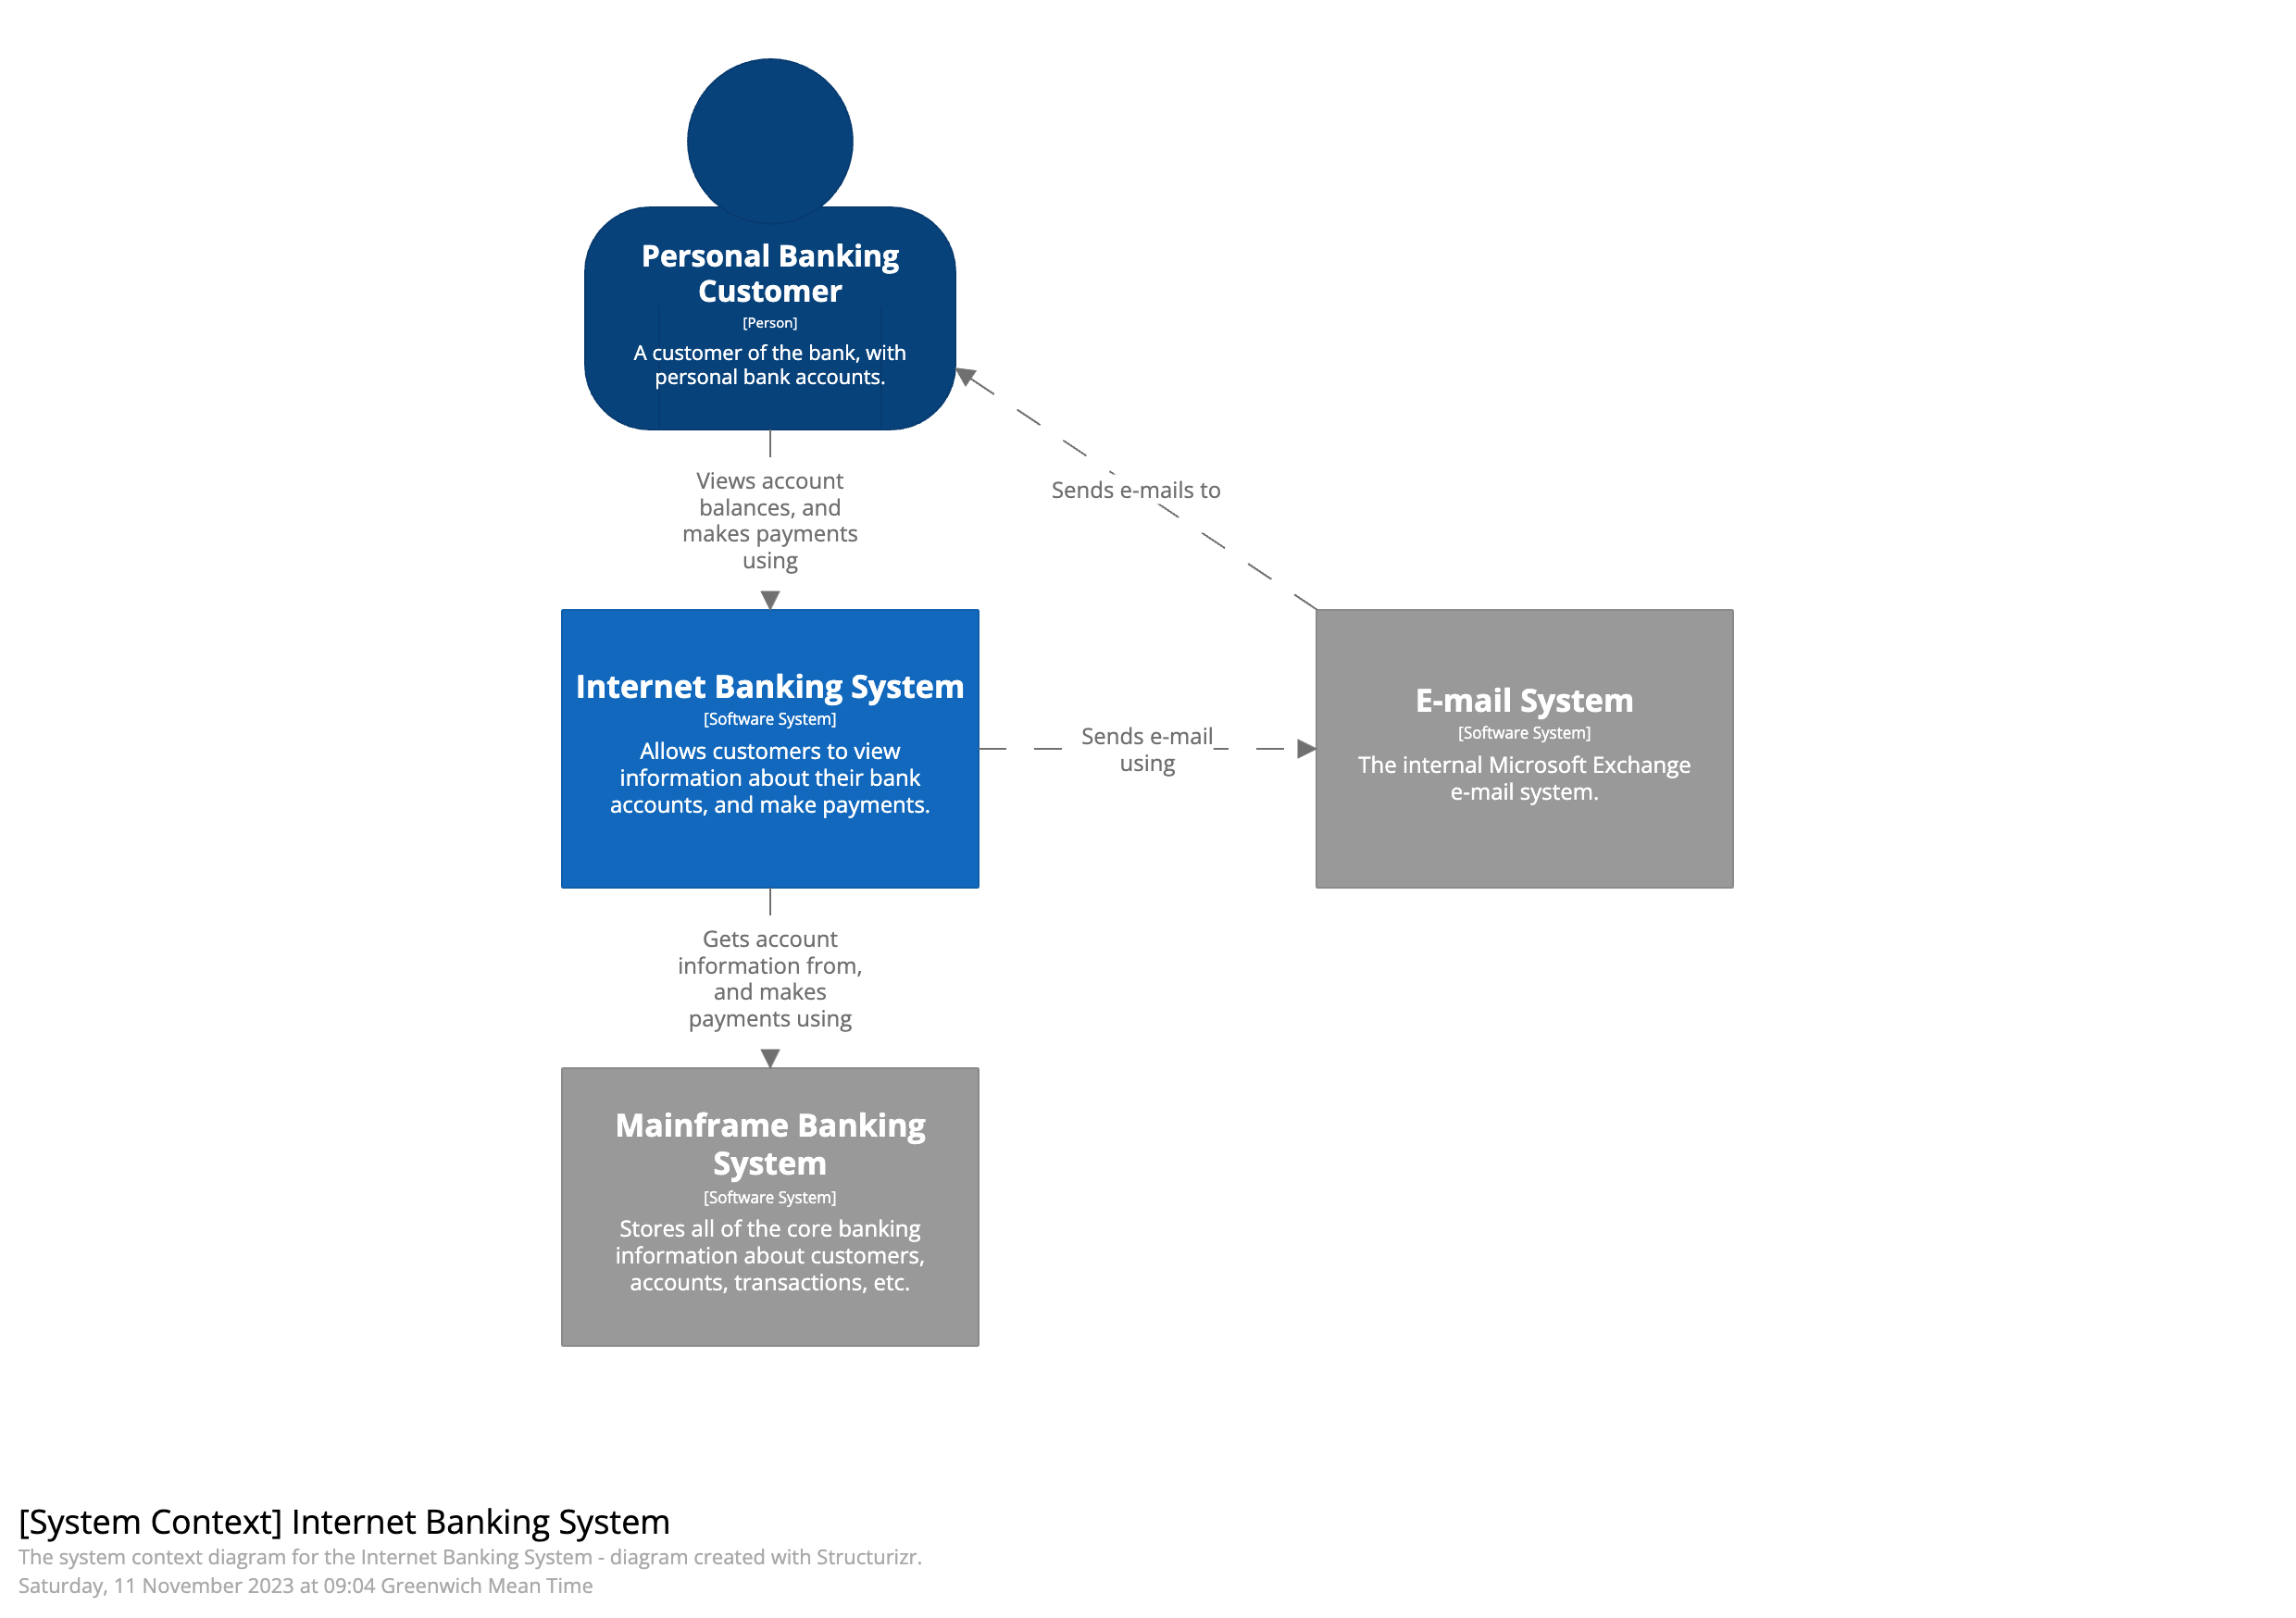
C4 Model เป็นรูปแบบในการใช้ diagram เพื่ออธิบาย software architecture สำหรับสือสารภายในและภายนอกของทีม software development โดยแบ่งเป็นระดับตามจุดประสงค์ของการสื่อสารใน 4 ระดับ
System Context เป็น high-level ของระบบ software system ที่ให้บริการกับ User หรือ system ด้วยกันเอง และแสดงรายเอียดของ system อื่นๆ ที่เกี่ยวข้องด้วย (system dependency) มีการใช้ term อย่างเช่น application, product, service เป็นต้น scope ของ software system สามารถมองได้หลายมุม เช่น ในระดับ ทีม development, code repository หรือ กลุ่มของ application ที่ต้อง deployment ไปด้วยกัน
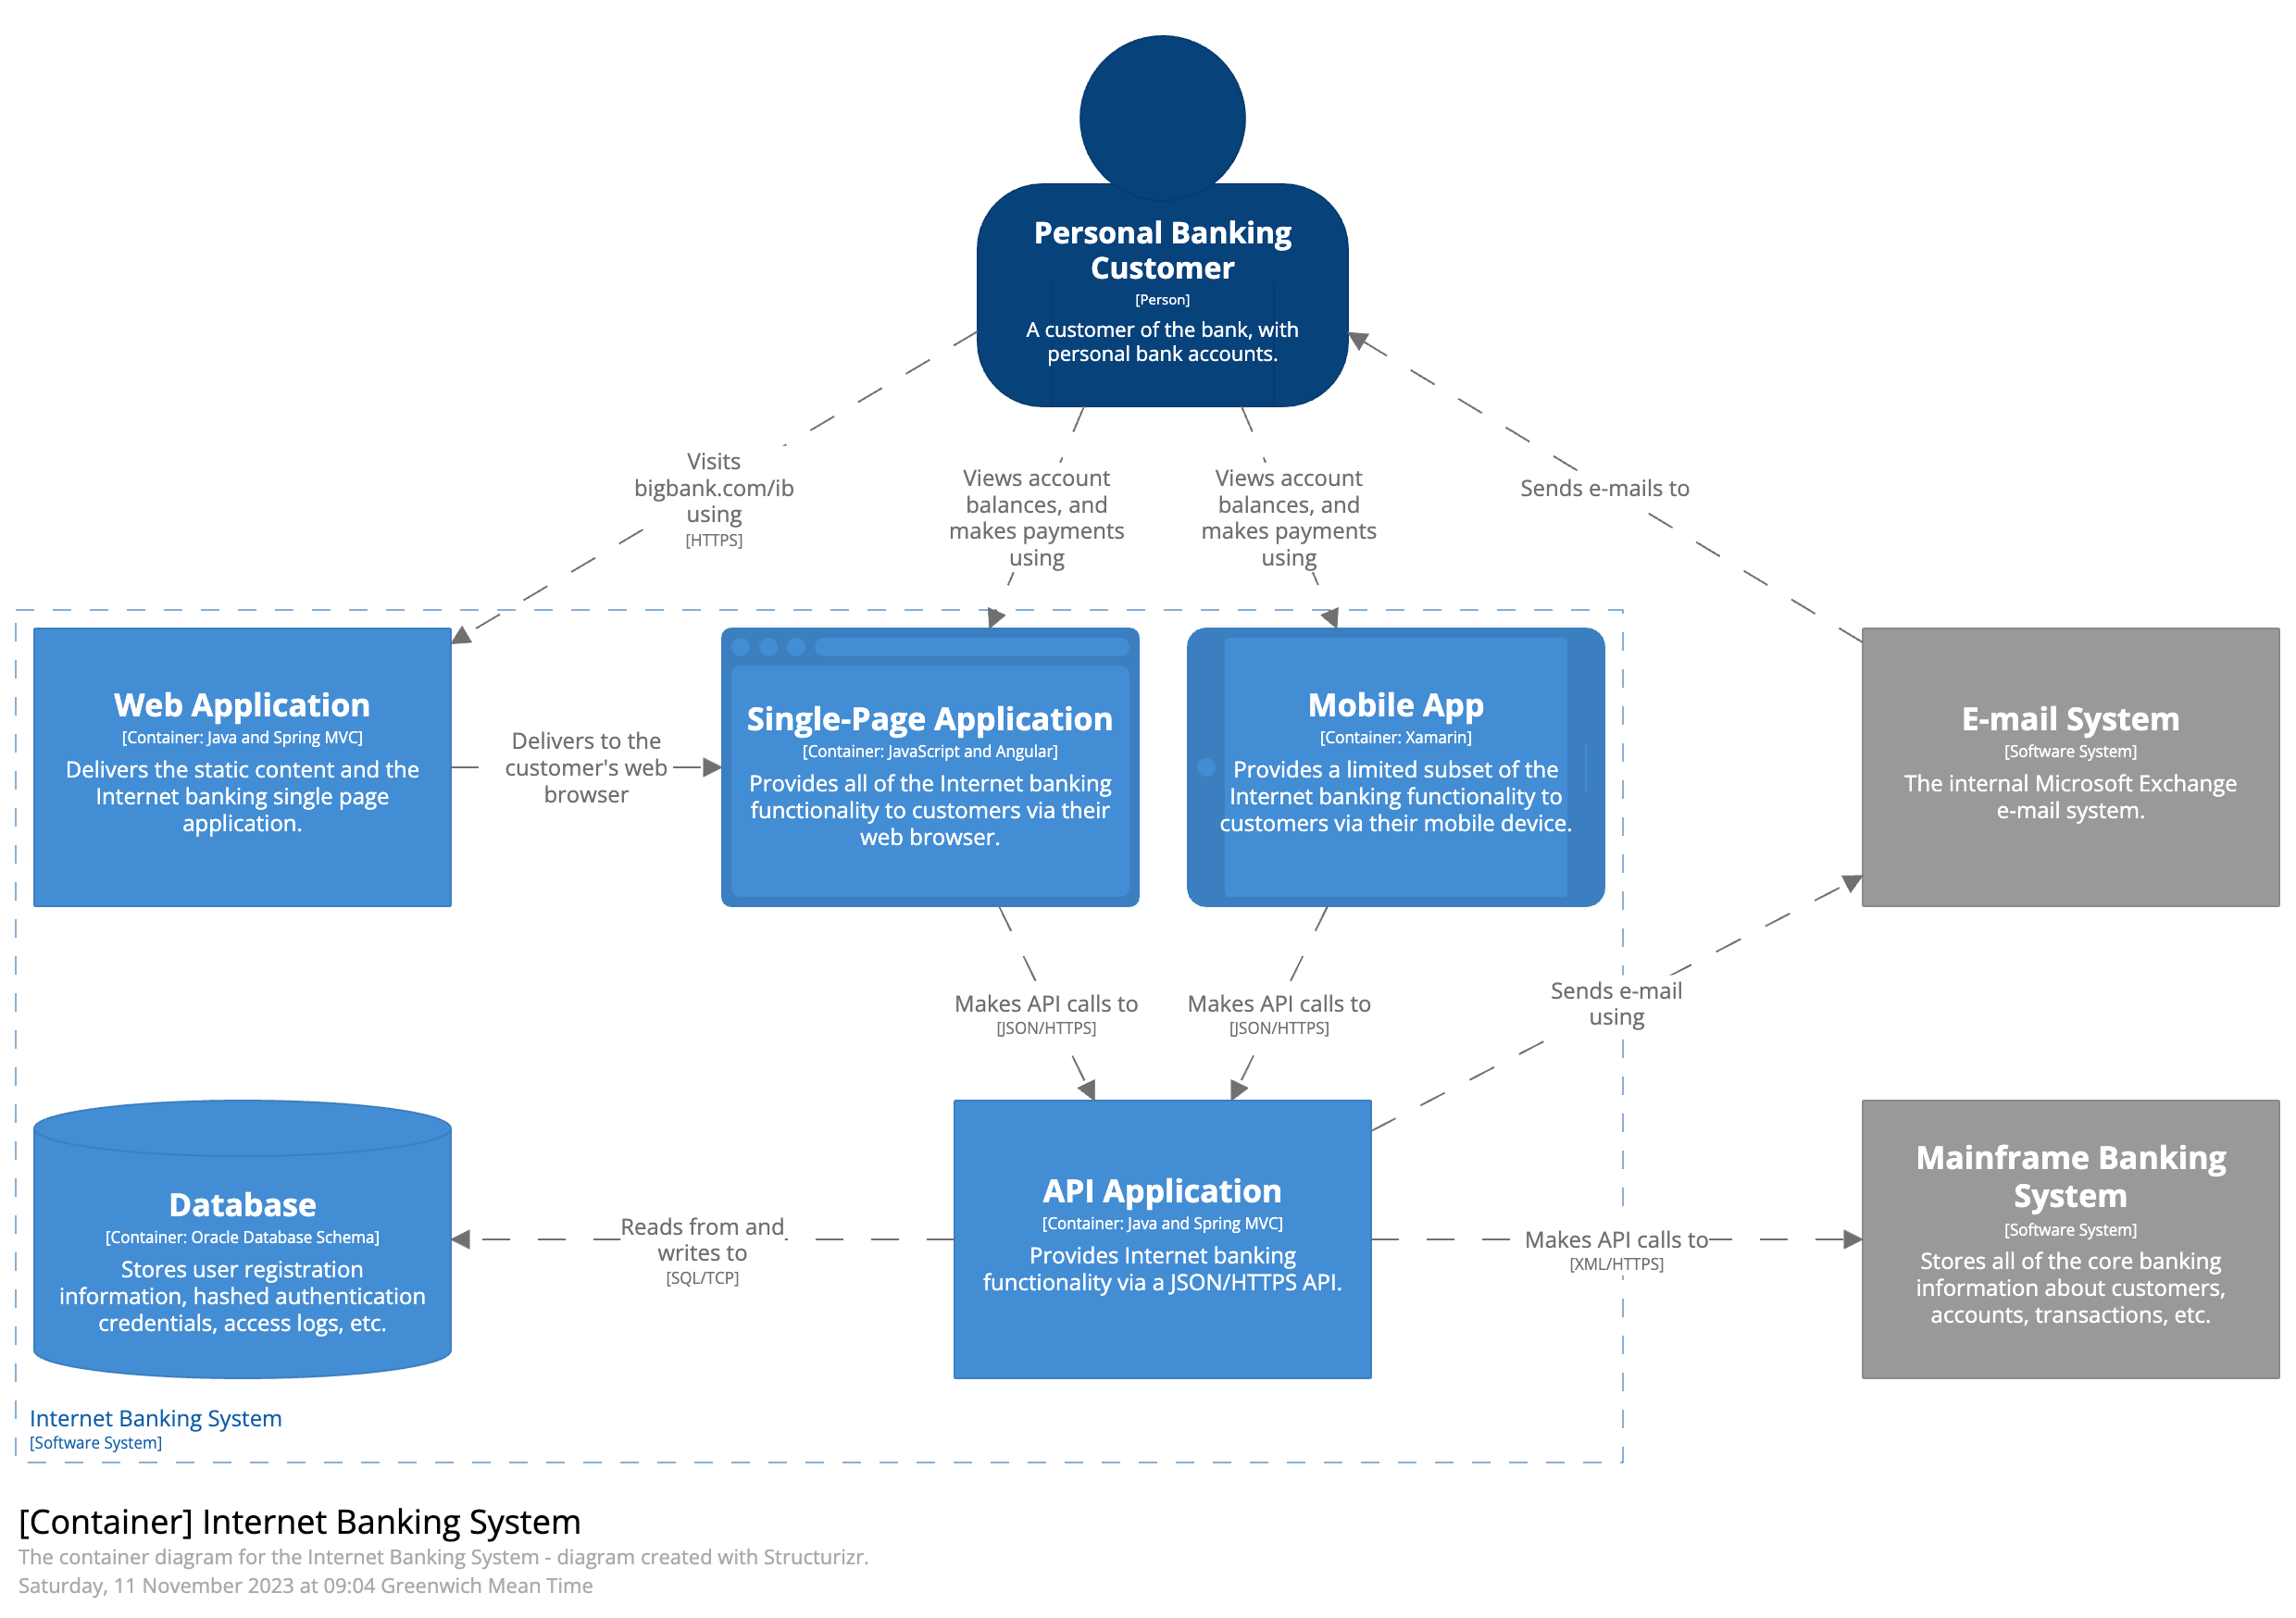
Container กลุ่มของ application และ data store ที่ประกอบอยู่ใน software system เพื่อให้ระบบทำงานได้ เช่น web application, mobile app, serverless function, database, file system, shell script เป็นต้น
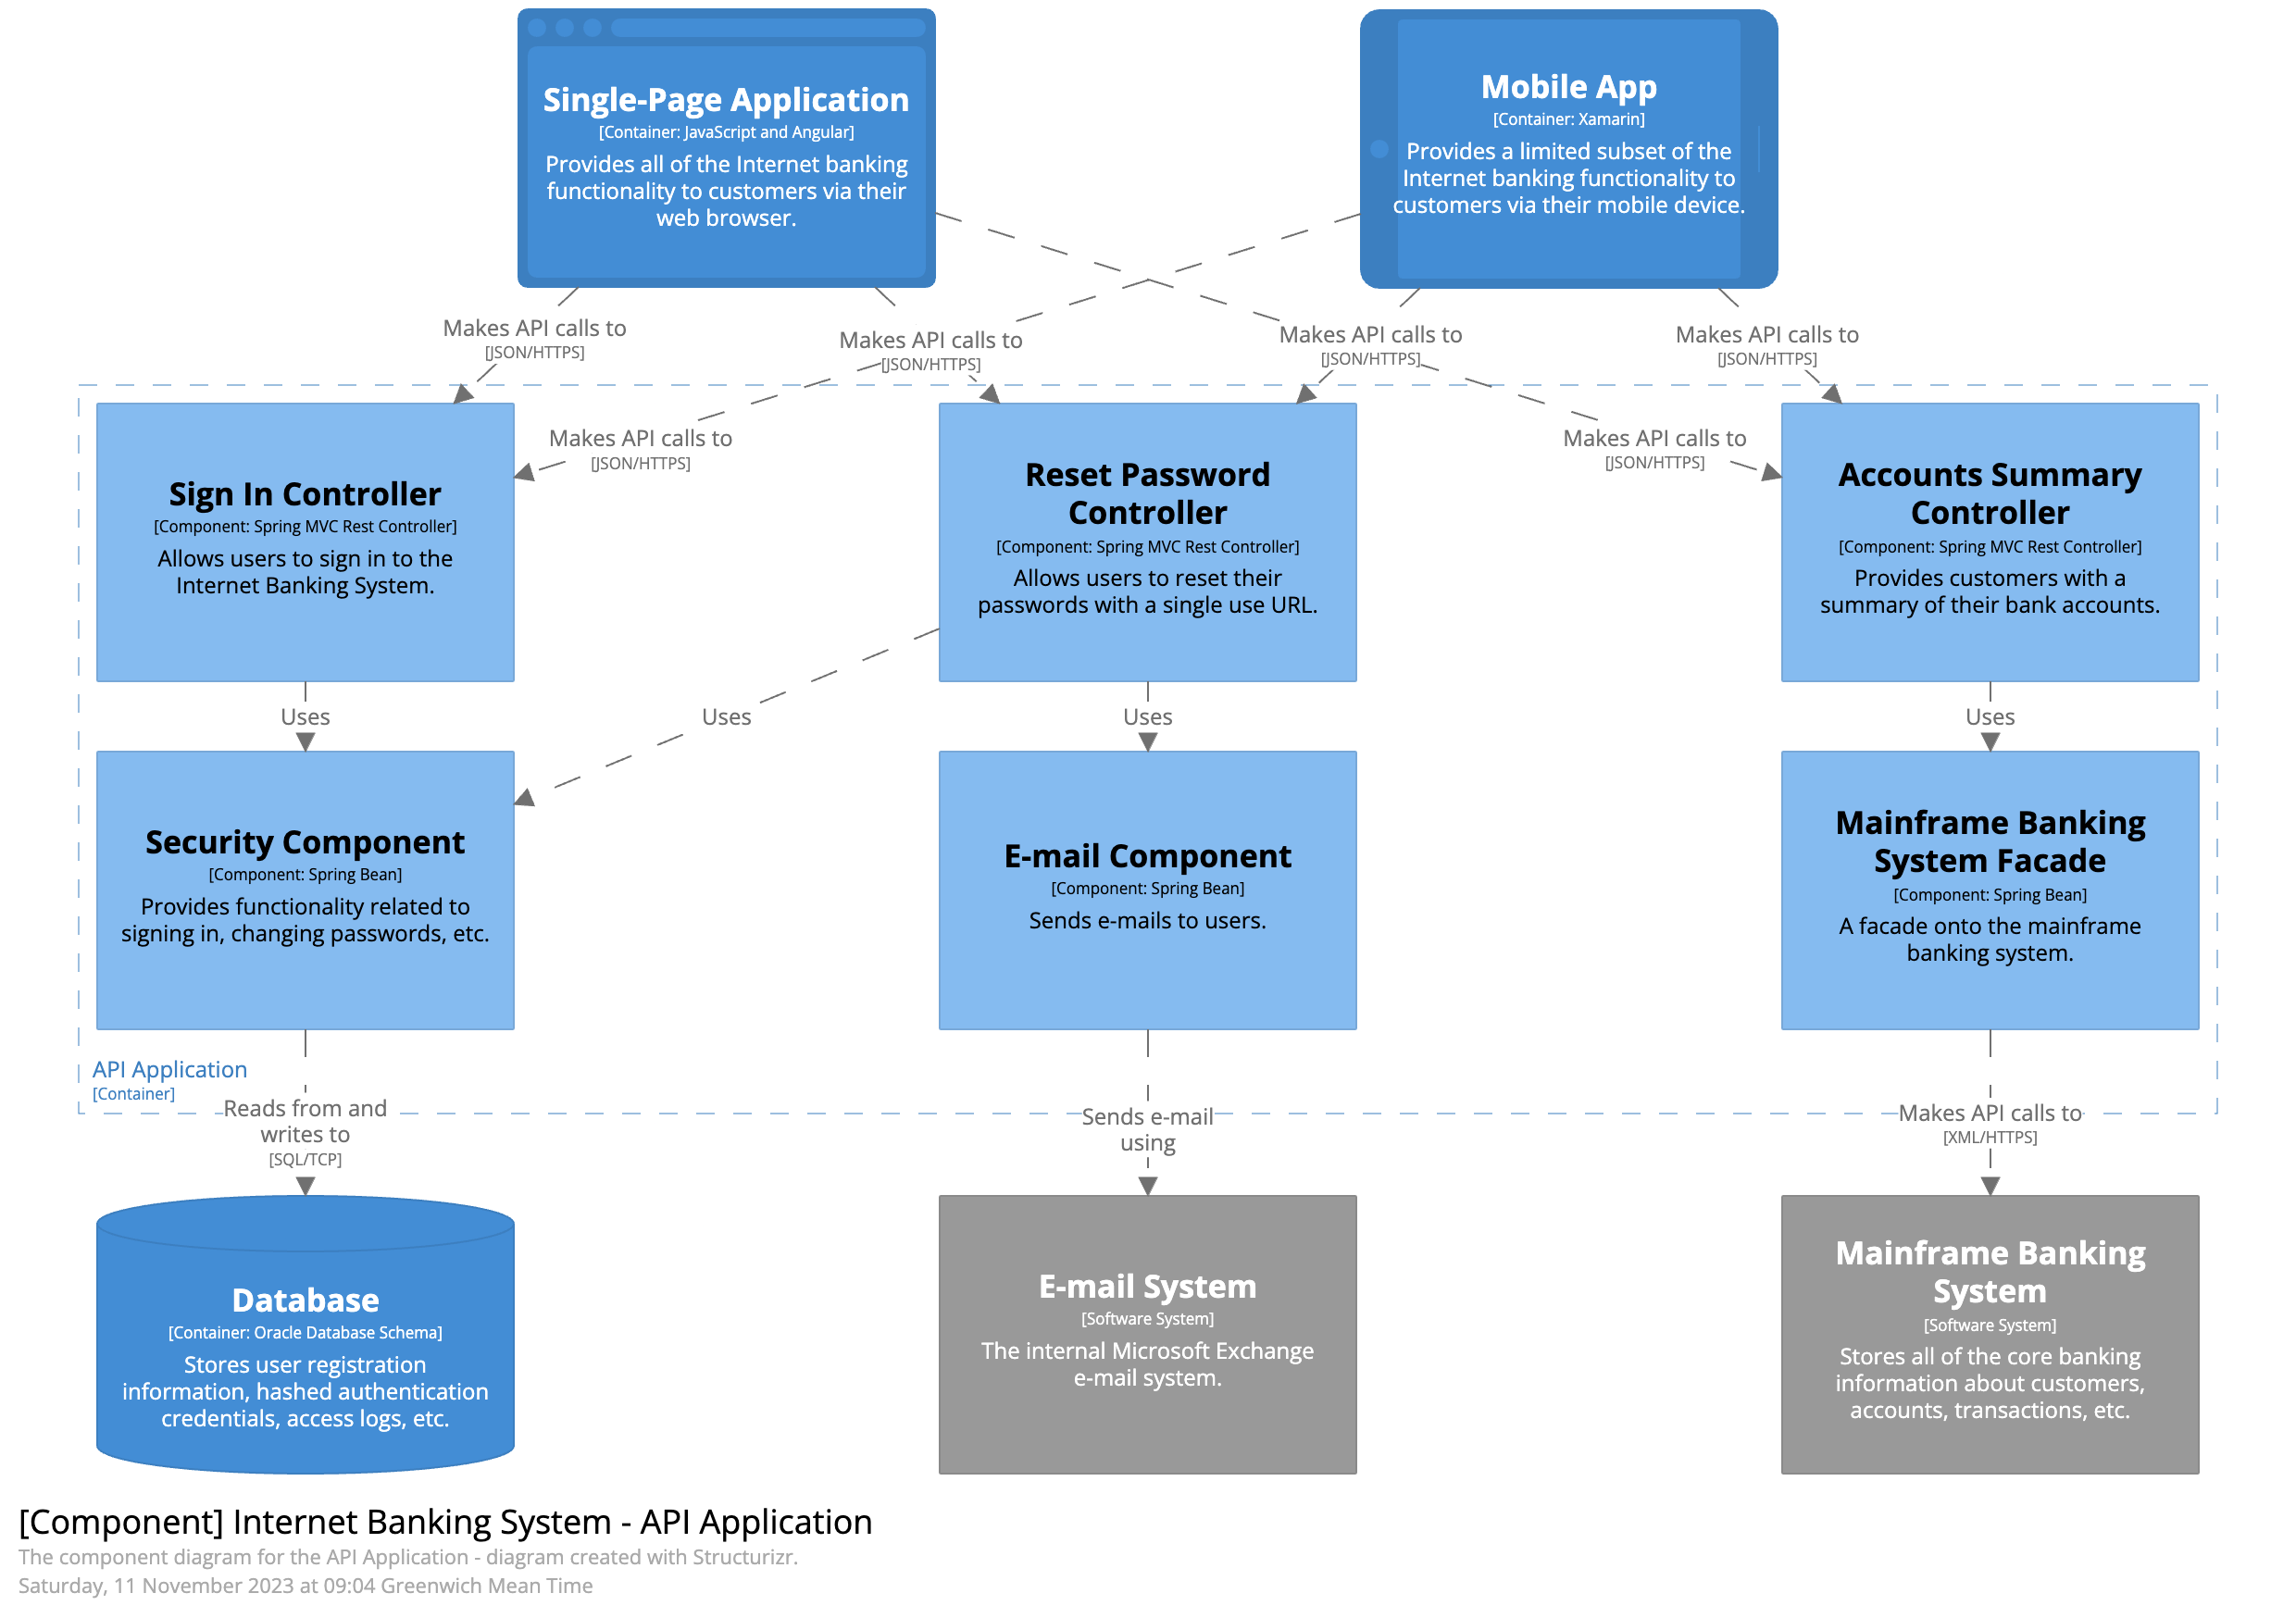
Component กลุ่มของ function ที่เกี่ยวข้องภายใน Container ที่ประกอบกันเพื่อให้บริการกับภายนอก components อาจจะมีมากกว่าหนึ่ง component ในหนึ่ง container แต่ทั้งหมดจะมี deploy unit เดียวกัน หรือทำงานใน process เดียวกัน
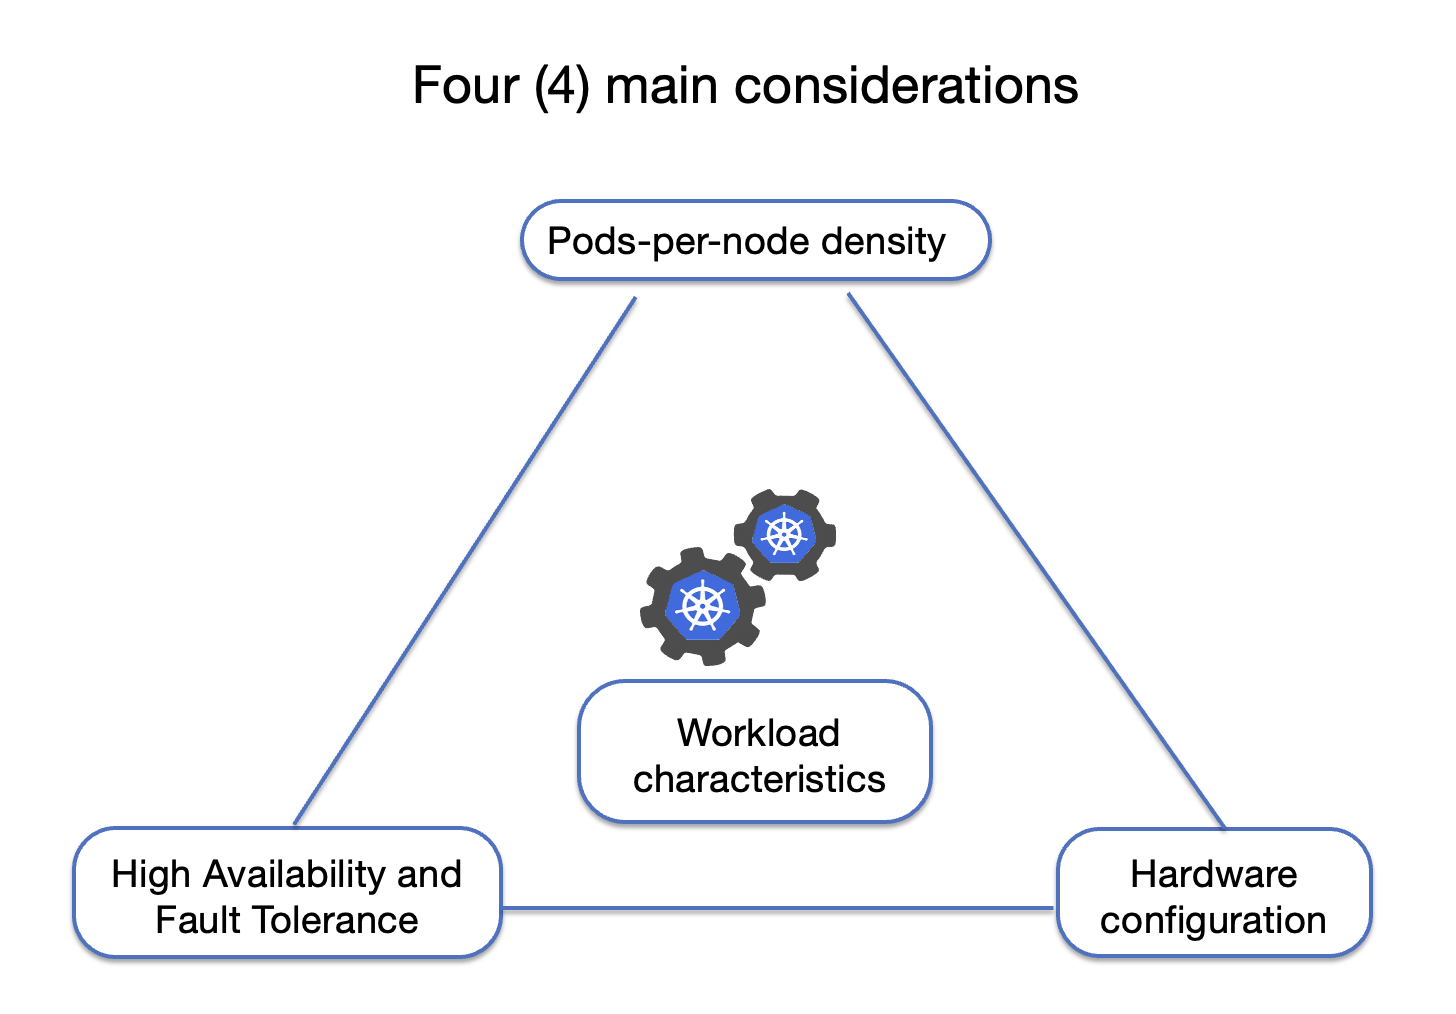
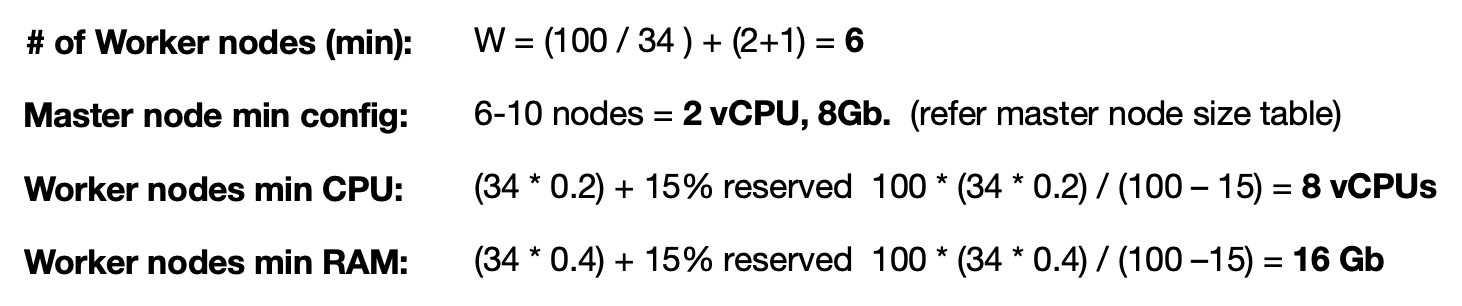
คือจำนวนของ Pod ซึ่งเป็น deployable unit (containers) ที่สามารถทำงานได้ต่อหนึ่งเครื่อง (Node) โดยเราต้องมีข้อมูล
vCPU ที่ pod ใช้งาน อาจจะใช้ cpu limit (ปกติจะต้องทำ cpu limit ไว้ เพื่อไม่ให้ pod ใช้ cpu ของเครื่องหมดจนส่งผลกระทบทั้ง cluster)
vCPU ของเครื่อง (Node) สำหรับใช้ในการ run pod
vCPU ทั้งหมดของเครื่อง (Node)
เปอร์เซ็นต์ของ cpu ที่จะ reserve ไว้สำหรับงานอื่นๆ เช่น system process
จากนั้นก็จะสามารถหาค่า pod per node density ได้จากการหาว่ามี vCPU สำหรับใช้ได้จริงเท่าไหร่ แล้ว หารด้วยค่าเฉลี่ยของ vCPU ที่ pod ใช้งาน เช่น
Node VM มี 8 vCPU และต้องการ reserve vCPU ไว้ 15% สำหรับ system process โดยค่าเฉลี่ยที่ pod ใช้งาน cpu core คือ 0.2 vCPU ต่อ Pod ก็จะหา pod per node density ได้ดังนี้
vCPU ที่ใช้งานได้ = 8 – (8*15/100) = 6.8 vCPU
Pod per node density = 6.8/0.2 = 34
** การกำหนดค่าเฉลี่ย vCPU ที่ pod ใช้งาน ต้องพิจารณา pods per CPU core จากคำแนะนำของ Kubernetes ที่ 1 CPU core จะสามารถรองรับได้ที่มากที่สุด 10 pods และจำนวน pod ต่อ Node ไม่ควรเกิน 110 pods – https://kubernetes.io/docs/setup/best-practices/cluster-large/
ทำให้ pod per node density เพิ่มขึ้นเป็น = 100/4 = 25
หลังจากได้ pods per node density แล้วต้องคำนวณด้วย cpu core ที่ pod ใช้งานถึงจะ sizing ขนาดของ node ได้ว่าจะต้องเผื่อ cpu และ memory ไว้ที่เท่าไหร่ถึงจะเหมาะสม
หลักการที่เรามีแค่เหตุผลเดียวในการสร้าง class ขึ้นมาเพื่อทำงานใดงานหนึ่ง ไม่ควรให้ class ที่สร้างขึ้นมาทำงานหลายหน้าที่ (responsibility) เช่นออกแบบ class เพื่อหาพื้นที่รวมของรูปทรงต่างๆ ก็ไม่ควรให้ class นี้จะต้องทำเรื่องการแสดงผล (output format) ที่ได้ออกมาในรูป html หรือ json เพราะจะทำให้ class นี้ถูกสร้างขึ้นมาด้วยเหตุผลมากกว่าหนึ่งเหตุผล หรือถูกใช้หรือ support เฉพาะบางกลุ่มหรือบาง role
Object หรือ entities ต้องสามารถ extend ได้ แต่ต้องแก้ไขไม่ได้ เป็นหลักการที่ทำให้โครงสร้างของ code เดิมไม่กระทบเมื่อมี type หรือ object ที่แตกต่างออกไป เช่น การที่เรามี class สำหรับรวมพื้นรวมของรูปทรงสี่เหลี่ยม กับวงกลม ด้วย method sum() ถ้าเรามีสามเหลี่ยมเพิ่มขึ้นมาก็จะหลีกเลี่ยงการแก้ไข method เดิมไม่ได้ เราสามารถแก้ไขได้ด้วยการสร้าง interface shape โดยให้ type object ใดๆ สามารถ extend ไปเพื่อ implement logic หา area ตัวเอง ก็จะทำให้ mothod sum() ของเราก็ไม่ต้องแก้ไขอะไร เพื่อที่จะ support รูปทรงใหม่ๆ
interface ShapeInterface
{
    public function area();
}
class Square implements ShapeInterface
{
    // ...
}
class Circle implements ShapeInterface
{
    // ...
}
class AreaCalculator
{
    // ...
    public function sum()
    {
        foreach ($this->shapes as $shape) {
            if (is_a($shape, 'ShapeInterface')) {
                $area[] = $shape->area();
                continue;
            }
            throw new AreaCalculatorInvalidShapeException();
        }
        return array_sum($area);
    }
}
เป็นหลักการที่ object ของ supper class จะต้องสามารถแทนทีด้วย object ของ subclass ได้โดยที่ต้องไม่ส่งผลต่อ program และ object ของ subclass จะต้องสามารถ access ทุก method และ property ของ super class
public interface Bird{
    public void fly();
    public void walk();
}

public class Parrot implements Bird{
    public void fly(){ // to do}
    public void walk(){ // to do }
}// ok

public class Penguin implements Bird{
    public void fly(){ // to do }
    public void walk(){ // to do }
}  // it's break the principle of LSP. Penguin can not fly.
public interface Bird{
    // to do;
}

public interface FlyingBird extends Bird{
    public void fly(){}
}

public interface WalkingBird extends Bird{
    public void work(){}
}

public class Parrot  implements FlyingBird, WalkingBird {
    public void fly(){ // to do}
    public void walk(){ // to do }
}

public class Penguin implements WalkingBird{
    public void walk(){ // to do }
ถ้าเปลี่ยนใหม่ให้ penguin สือทอดจาก walkingbird ก็จะทำให้ถูกต้องตามหลักการ และไม่ส่งผมต่อ program ทำให้เกิด bug